Wednesday 27 August 2014

Prompts

Dashboard Prompt


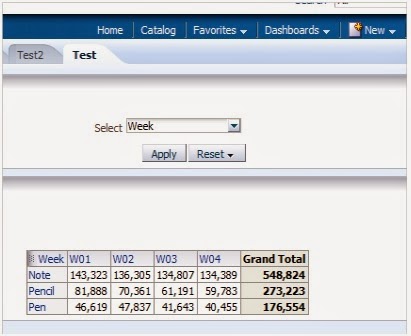
With the help of prompt we are applying filters to the reports dynamically at run time.

Lets see how to create  Dashboard Prompts:

Click New and Select Dashboard Prompt. 

Once the dashboard prompt is selected, It would prompt to select the Subject area for which dashboard prompt has to be created.


After selecting the subject area, the following screen appears:


In OBIEE, there are three types of Dashboard Prompt:

1) Column Prompt
2) Variable Prompt
3) Image Prompt

Column Prompt :  A prompt is created on a column (dimension attribute). With column prompt following can be done :

1) Prompt for column
2) Operative filter can be set.
3) It holds only column values
4) is prompted filter can be applied.
5) Presentation and Request Variable can be created.

 The following has to be set for a column  prompt:


Column - Refers to the Dimension for which prompt is created.
label - Name of the prompt
Operator - what kind of filter should be applied to the selected dimension attribute (equal to/greater than/between etc)


User Input - to set the type of prompt (check boxes, choice list, list box, radio button &slider etc)


Choice list values - to set the value that a prompt should hold (all column values, specific column values, members of group, all column values and specific member of groups)


Default Selection - specifies the value that a prompt should hold by default (None,specific values, variable expression, SQL results and server/repository variable)


Set a Variable - The values selected by the user at run-time can be assigned to a variable that is defined in this section (None, Presentation Variable and Request Variable)


Note :

1) With column prompt, only one filter condition can be applied to a column.
2) It cannot have user defined values in its choice list.
3) Data type of the variables cannot be changed.


Variable Prompt : A prompt is created using a variable. The values of the prompt can hold a column value or custom value ( a user defined value). User can set the data type for the variable values. The presentation variable (Sel_Year) will hold the values selected in the prompt. The following can be done with the help of Variable Prompt:

1) Prompt created for presentation Variable.
2) It can hold column values/ user defined values.
3) Filter is applied to the report using presentation variable.
4) Presentation variable can be created.
5) Prompt can be defaulted to a value.


Prompt for  - Presentation variable name has to be given , which will be created with the execution of prompt. 
label - Name of the prompt

User Input - to set how the prompt type (check boxes, choice list, list box, radio button &slider etc)


Choice list values - to set the value that a prompt should hold (all column values, specific column values, members of group, all column values and specific member of groups)


 Variable Data type:


 Default Selection - specifies the value that a prompt should hold by default (None,specific values, variable expression, SQL results and server/repository variable)


Note :

1) With variable prompt, operative filter cannot be applied.
2) Request variable cannot be created.
3) isprompted filter condition cannot be applied.

Tuesday 26 August 2014

Filter and Protected Filter

Filter  and Protected Filter

Filter (Is Prompted):
Prompt Filter is applied to a report using “isPrompted”.

Example :  Lets consider we have a dashboard with a Year Prompt (Year column) and a Yearly Report.

Year Prompt does not have any selected Year unless and until user selects any year.


Yearly Report has the columns Year and Sales Volume in it. And the report has filter condition as “Year is Prompted”


Yearly prompt and report is placed in dashboard as shown below:


When dashboard is executed, Yearly prompt does not have any values selected, then by default report displays product sales volume for all the year.


When user selects any specific year in Yearly Prompt , then report displays product sales volume for the selected year.


Filter Vs Protected Filter:
Report filter can be applied using different operators like (is equal to, is not equal to, greater than, lesser than, top, bottom, isprompted, filter based on the result of another results, advanced filter can be applied with session, presentation and repository variable)

Example :  Lets consider we have a dashboard with a Year Prompt (Year column) and a Yearly Report.


Year Prompt does not have any selected Year unless and until user selects any year.


Yearly Report has the following attributes and measures: Product, Sales Volume and Year.

Yearly Report has two filter conditions:

1) Year is Prompted
2) Year between 2010 and 2012


By Default when user executes the dashboard, report displays the product sales volume for the Year : 2010, 2011 and 2012.


When user selects Year ‘2014’ in Yearly Prompt , then  report displays Product sales volume for the year that is selected in the prompt.


Even though Year between 2010 and 2012 filter is applied in the report, the report displays product sales volume for the year 2014 if the year 2014 is selected in the prompt. So, filter applied in the report can be overridden by the prompt. Due to this, it displays the product sales volume for the year 2014.


Protected Filter:

Lets consider the above scenario, a Year prompt and Yearly Sales report.

In Yearly Sales report we have attributes and measures like : Product, Sales Amount, Year
Two filters applied as above:

1) Year is prompted
2) Year between 2010 and 2012

Here in order to ensure that report filter should not be violated, we mark this filter Year between 2010 and 2012 as Protected

Year between 2010 and 2012 filter is marked as protected


The prompt and dashboard is placed as shown below:


By default, when dashboard is executed, it displays the product sales volume for the year : 2010,2011 and 2012.


But when 2009 is selected in the prompt which violates the protected filter (year between 2010 and 2012) that is given in the report, then it displays No Results.


Friday 22 August 2014

Prompt Scope


Prompt Scope


There is a dashboard test. And it has one page with year prompt and yearly sales volume report. And now the requirement is to create a new page under test dashboard with a year prompt and yearly sales value report. And yearly sales value report should display results based on the values selected in the year prompt that is available in page 2. Also the year prompt in page 2 should not affect the report in page 1 since both the report has same year prompt. But the year prompt in page 1 can affect the report in page 2.

1) A Year prompt should be created and placed in a dashboard page
2) Report contains Year and Total Sales Amount, which should display total sales amount for the year selected in the prompt.
3) if user selects a particular year from the prompt that is available in the new page, then it should affect only the reports available in that page. It should not affect other page reports that is available under same dashboard since all the page has prompt on same column(year).

Let’s see how to create a prompt:

Login in to the application. Click New and Select Dashboard Prompt


This selection will then ask you to select the subject area  from which you need to create a prompt.


Once the subject area is selected , Following screen appears.


Need to select the appropriate prompt type. Once column prompt is selected then the following screen appears.


Column prompt is created on a dimension attribute. And here year is selected from time dimension. Then the appropriate operator for filter should be selected. The Operator can be is equal to/is in or greater than, lesser than etc.


Then the user input should be selected which can be a text field, choice list,check boxes, radio buttons and list box.


After selecting the user input, need to initialize or assign the values to the prompt with which the filter be applied to the reports in a dashboard. Prompt values can come from column or specific column value or SQL Results or Members of Groups and All column values and specific groups.


Default value can be set to the prompt using default selection. Default value can be specific values, none, server variable/repository variable,Variable expression  and sql results)


With this Set a Variable option, a presentation variable/request variable can be created. And it will hold the values selected in the prompt.


Prompt placed in the dashboard page as shown below:


And now Prompt and report is created and placed in a dashboard page. Lets see how to set the scope for the newly created prompt.

Prompt Scope:

Prompts in the dashboard can have two types of scope:
1) Dashboard 
2) Page

Dashboard : if a scope of a prompt is set to dashboard, then the values selected in a prompt will affect all the other reports that is available in other pages of the dashboard provided if the prompt/report uses the same column. Dashboard prompt will overwrite the values in page prompt.

Page :if a scope of a prompt is set to page, then the values selected in a prompt will not be carried to the other pages under same dashboard even if same column prompt is used in other pages of the dashboard

To set the scope of the prompt that is placed in dashboard:

Right click Section Properties and then click Scope. Then Select page. Therefore the prompt in page 2 is set to page scope which only affects page 2 reports.


Example : We have dashboard Test. Under Test dashboard, we have two pages: page 1 and page 2.
Page 1 and Page 2 has two different reports and a Prompt on Year column. By default reports at page 1 and page 2 displays sales amount for completed year since year prompt is defaulted to completed year. And as per requirement  

page 1 year prompt - dashboard scope (affects both page 1 and page 2 reports)


page 2 year prompt - page scope ( affects only the page 2 reports)


Behaviour

Scenario 1 : By default, page 1 and page 2 displays the sales volume and Sales Amount for the year 2013, since the prompt is defaulted to completed year.


Scenario 2 :When year 2012 Selected in Page 1 prompt then reports at page 1 and page 2 will be affected since scope of the prompt is dashboard.


Scenario 3: When year 2012 Selected in Page 2 prompt then reports only at page 2 will be affected since scope of the prompt is page.


Monday 4 August 2014

Dynamic Reports in OBIEE 11g

Dynamic Report in OBIEE11g

We had a requirement to generate* reports dynamically based on the values selected in the prompt.

Example:
Reports generated dynamically based on the values selected in the prompt: 
Reports : There are two reports Yearly Sales Report and Weekly Sales Report to be displayed in a single dashboard page.
Prompt :  The prompt has values like Year and Week.
By default dashboard page need to display only the yearly sales report and if User selects value ‘Week’ in the prompt then it should display only weekly sales report.

This dynamic report generation can be implemented in two ways.

Method 1:
A  variable prompt is created with two user-defined values : Week and Year as shown below:

Presentation variable Pres_Var is created which holds the value selected in the prompt. It can hold more than one values. And report is filtered based on the values in Pres_Var.

/

Select prompt is defined with two custom values Week and Year. 
Weekly and Yearly sales report  is created.

Reports and  prompt is placed in the dashboard as shown below:-

Apart from this, an intermediate report(Yearly_Inter_Report) is created for Yearly Sales report. 


Column Formula for Year column is changed to ‘Year’ through edit formula.


A filter is applied to year column with Presentation Variable (Pres_Var}


The Pres_Var  will hold the value that is selected  by the user in the prompt. It can be either (Week/Year). If it is Year then a filter will be applied in the inter report where ‘Year’ = Year which will return a record with Value Year.


Similar inter-report is created for week as well.

Filter on ‘Week’ should be applied only after changing the edit formula. It should have ‘Week’. Only then this filter evaluates to true.

In section of Yearly sales report a condition will be applied on the yearly inter report


Condition is applied on the intermediate report (Yearly Inter report)


if the analysis returns atleast one row or more than one row, then the condition evaluates to true.


Here if user selects Year, then @{Pres_Var}  holds the value (Year) which would return 1 row. Then as per the condition, the Yearly report will be displayed.


Similar to this, Weekly inter report is a created and condition is applied on  the weekly sales report section with this weekly inter report.


In dashboard, by default  Yearly Sales report will be displayed since the prompt is defaulted to Year.


When user selects week, then weekly sales report will be displayed.


Method 2 : (Without multiple inter report)
A prompt is created with two pre-defined values : Week and Year.
Two reports Weekly and Yearly sales report is created .
Prompts and reports placed in dashboard.

One Yearly Inter report can be created, whose formula can be modified as given below:
Column Formula can be given as Case when ‘@{Pres_Var} = ‘Year’  Then  TableName.ColumnName  ELSE ‘None’ END


Therefore When Pres_Var = ‘Year’ Then it might return multiple records else it will return one record with Value ‘None’

Therefore Conditions can be applied in sections of weekly and yearly sales report with one single Intermediate report instead of creating multiple inter-reports for generating dynamic reports.

Condition in Section of Yearly Sales Report


Condition in Section of Weekly Sales Report


Therefore  If the Yearly Inter-report results in one row then weekly sales report is generated. If it retrieves more than one row then yearly sales report is displayed.